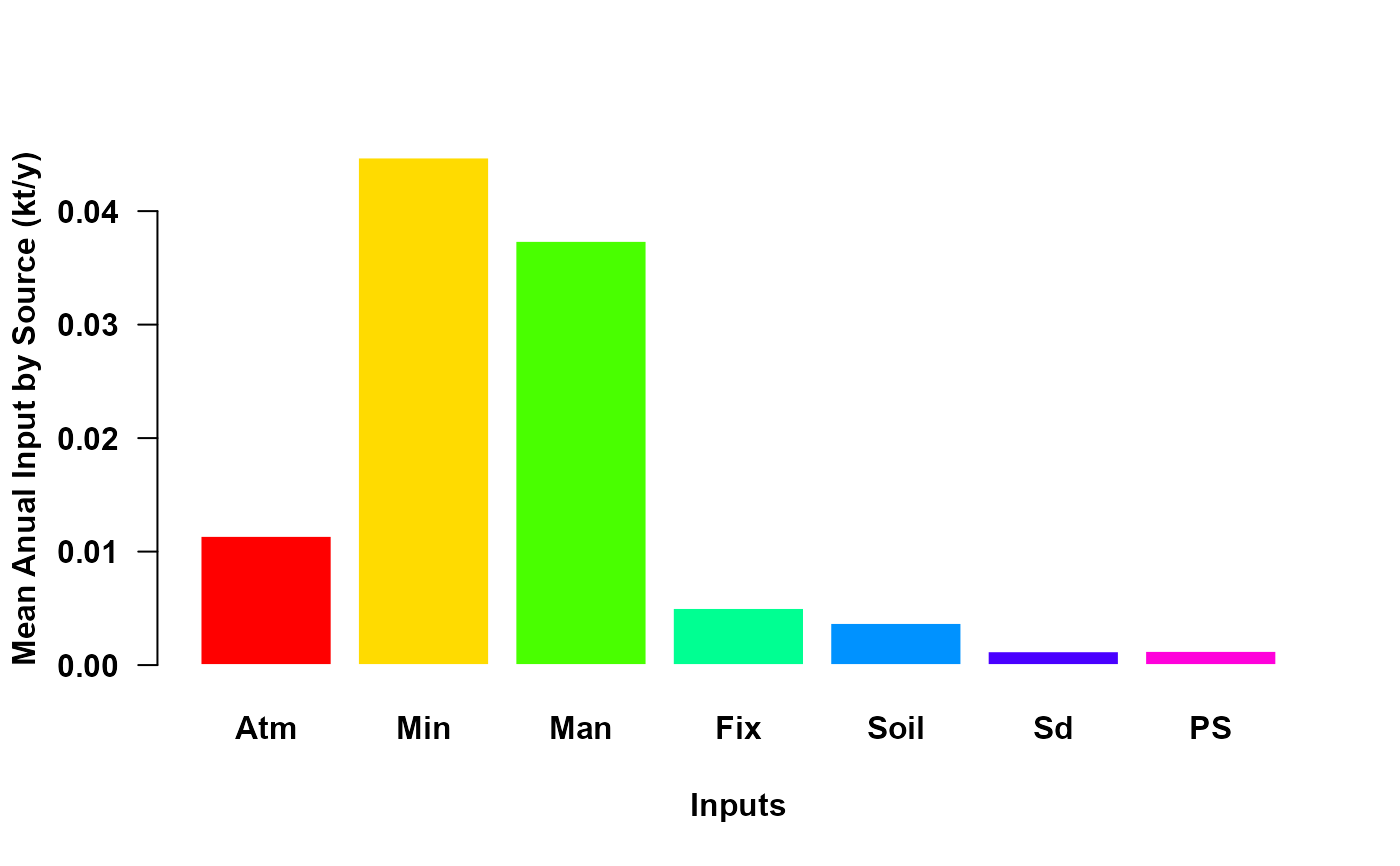
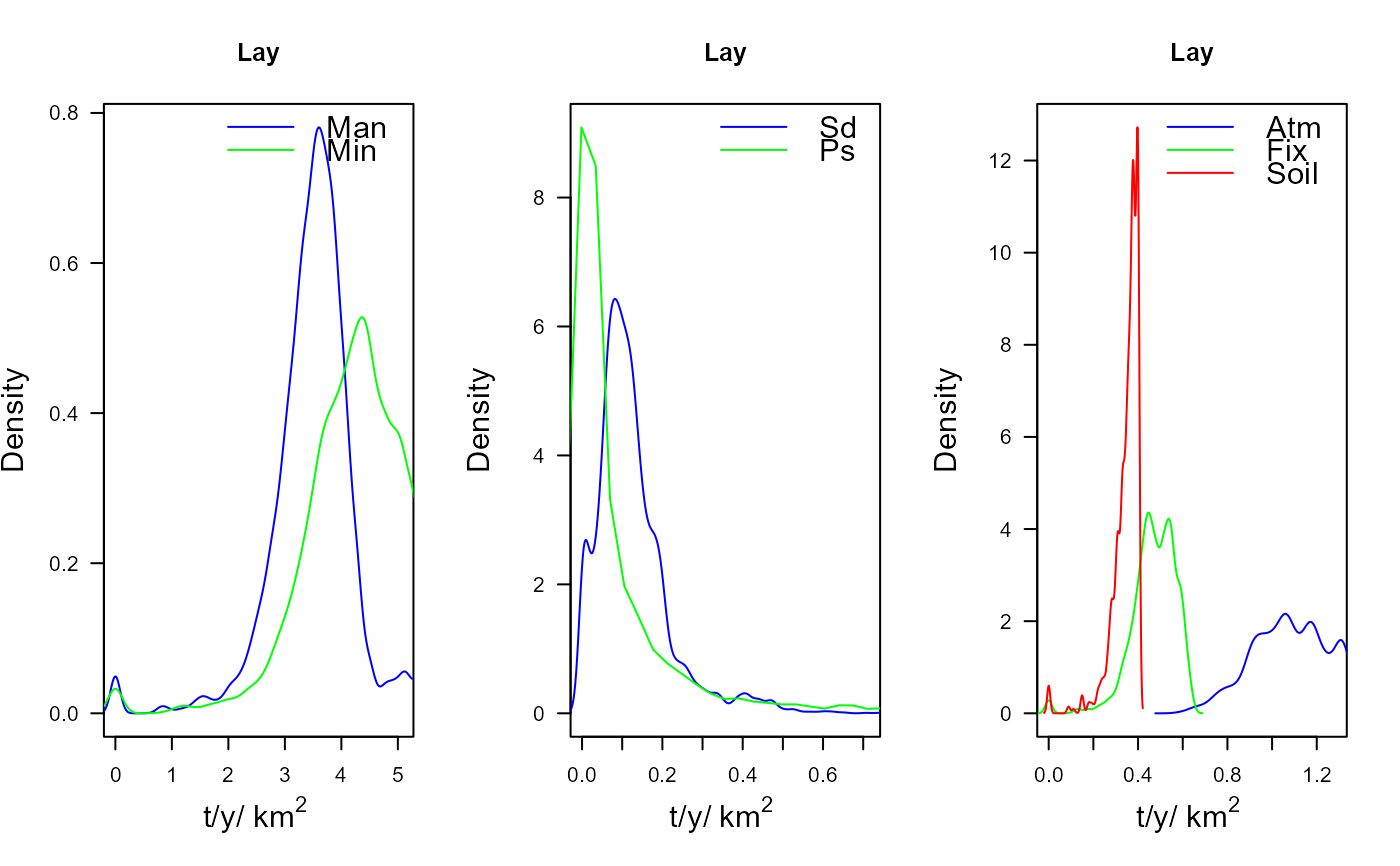
A grouped barplot representing the average input load by source for the whole basin or a three density plots showing the distribution of nutrient sources (7 for nitrogen, 5 for phosphorous).
Arguments
- annual_data
data frame. Sources of nutrient for each year and catchments.
- sh_file
sf object. The spatial information.
- basin_name
character. The title of the plot.
- plot.type
character. Possible values: Bar plot ("B") or Density plot (“D”).
- coef_SD
numeric. The standard deviation coefficient.