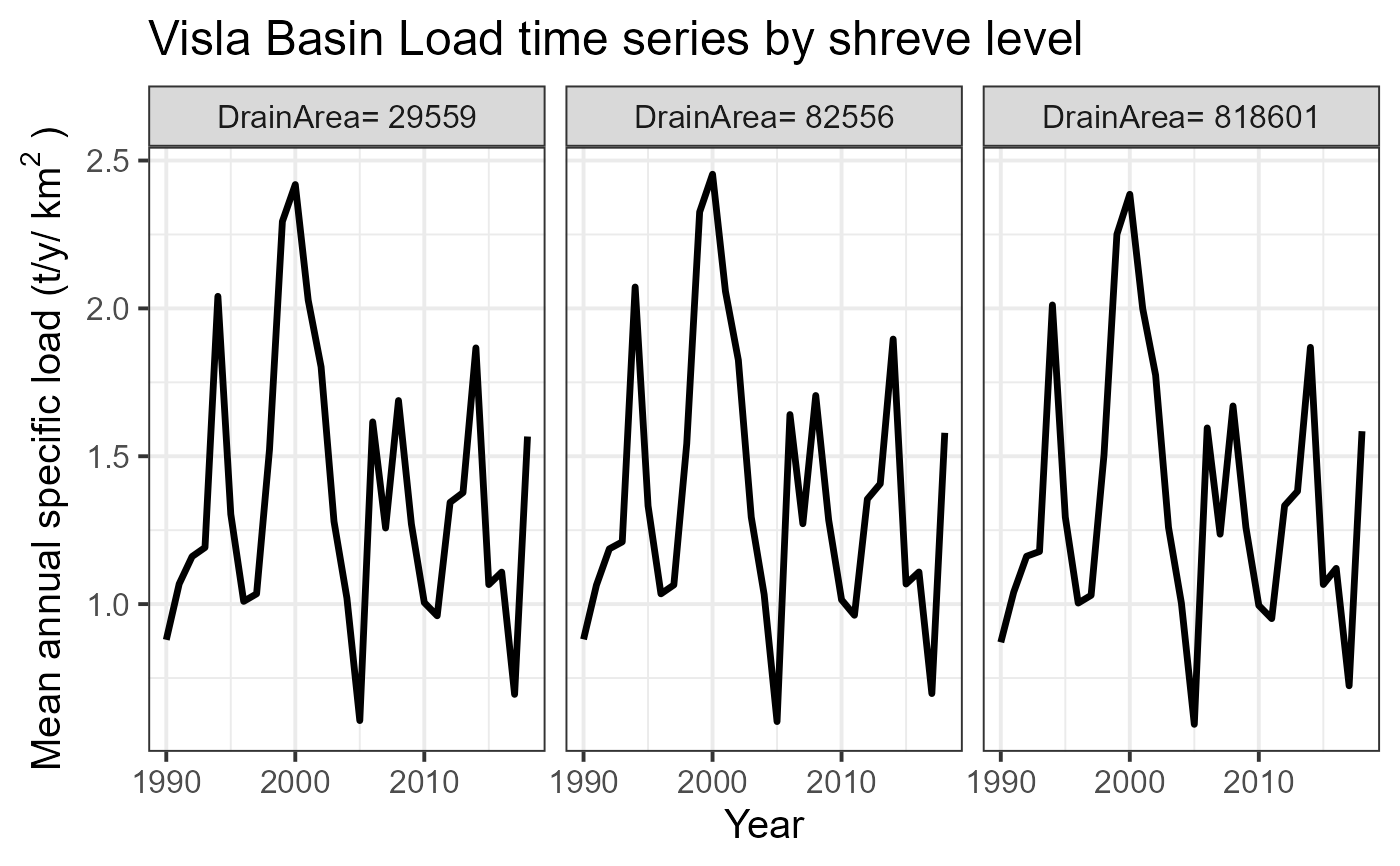
Creates a time series plot showing basin model results
Arguments
- green_file
data frame. Nutrient Load by source apportionment of nutrient for each year and catchments.
- sh_file
sf object. The spatial information.
- basin_name
character. The title of the plot.
Examples
# \donttest{
# the data of the TN scenario
data(catch_data_TN)
data(annual_data_TN)
data(sh_file)
# the parameter to assess the basin model
alpha_p <- 35.09
alpha_l <- 0.02
sd_coef <- 0.2
# years in which the model should be executed
loc_years <- 1990:2018
# Computing the source apportionment
basin_sa <- green_shares(catch_data_TN, annual_data_TN, alpha_p, alpha_l,
sd_coef, loc_years)
basin_name <- "Visla Basin"
nutrient_tserie_darea(basin_sa, sh_file, basin_name)

# }
# }
