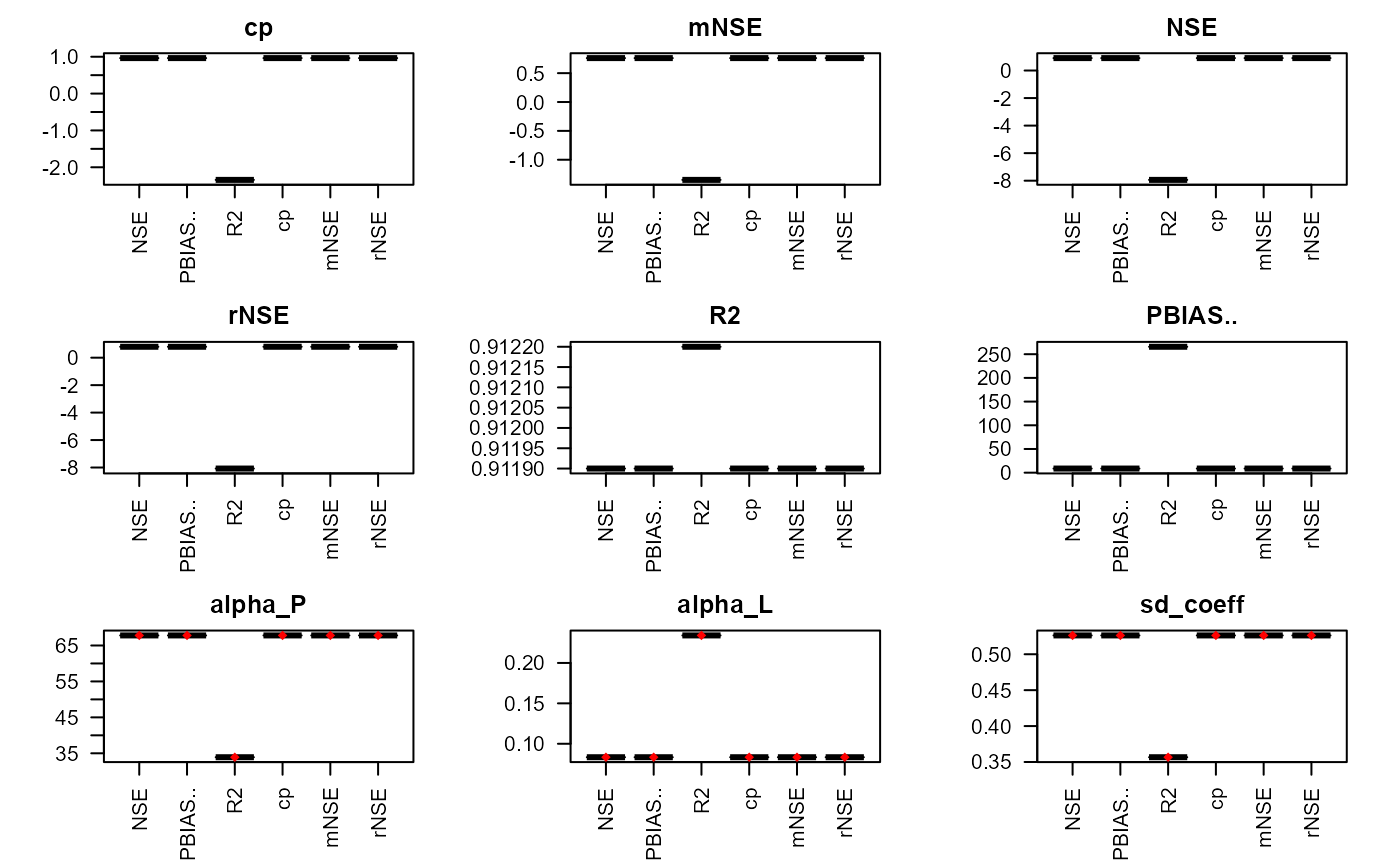
Returns boxplots of best model parameters ranked according to different goodness-of-fit measures, and also boxplot with the distribution of the parameters values.
Arguments
- df_cb
data frame. Table with the result of the calibration process.
- rate_bs
numeric. Rate (%) of parameters selected from the whole set produced in the calibration.
Examples
# \donttest{
# the data of the TN scenario
data(catch_data_TP)
data(annual_data_TP)
# the parameter for the calibration of the model
n_iter <- 2 # number of iterations
# the lower limits for all params (alpha_P, alpha_L, sd_coef)
low <- c(10, 0.000, 0.1)
# the upper limits for all params (alpha_P, alpha_L, sd_coef)
upp <- c(70, 0.3,  0.9)
# years in which the model should be executed
years <- 1990:2018
# execution of the calibration
df_calib <- calib_green(catch_data_TP, annual_data_TP, n_iter, low, upp,
years)
#> [1] "Elapsed time: 9.41"
# Generating the box plots
rateBS <- 5 # rate of best set of parameter to include in the plots
calib_boxplot(df_calib, rateBS)
#> [1] 18
#> [1] 6
#> [1] 9
#> [1] 8
#> [1] 5
#> [1] 10
#> [1] 17
#> [1] 19
#> [1] 15
#> [1] 20

# }
# }