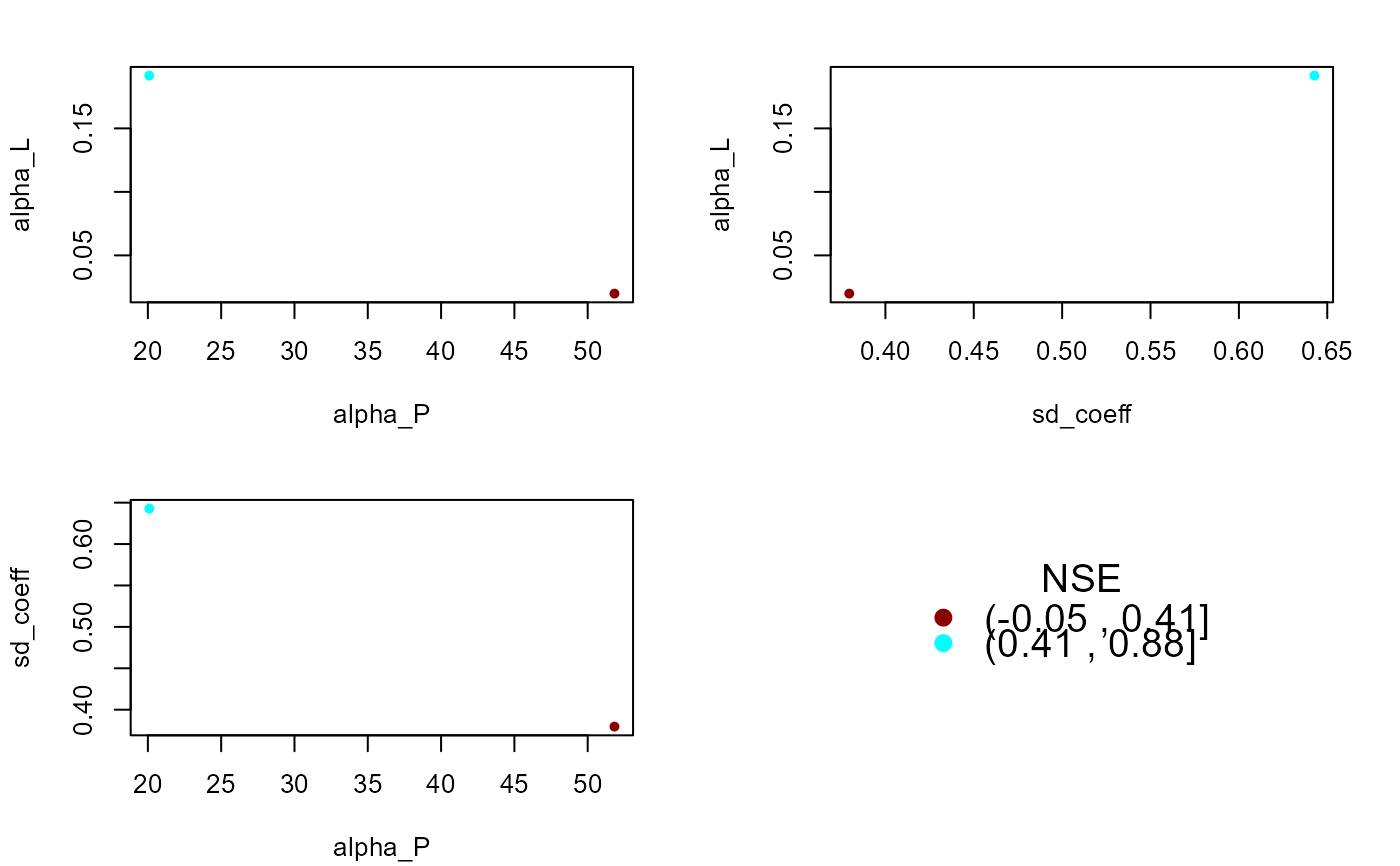
Dot plot of goodness-of-fit metric vs parameters value
Arguments
- df_cb
data frame. A table with the result of the calibration process.
- param
character. Goodness of fit measures. See alternatives link "NSE" "rNSE", "NSE", "mNSE", "MAE", "PBIAS", "cp", "R2".
Examples
# \donttest{
# the data of the TN scenario
data(catch_data_TN)
data(annual_data_TN)
# the parameter for the calibration of the model
n_iter <- 2 # number of iterations
# the lower limits for all params (alpha_P, alpha_L, sd_coef)
low <- c(10, 0.000, 0.1)
# the upper limits for all params (alpha_P, alpha_L, sd_coef)
upp <- c(70, 0.3,  0.9)
# years in which the model should be executed
years <- 1990:2018
# execution of the calibration
df_calib <- calib_green(catch_data_TN, annual_data_TN, n_iter, low, upp,
years)
#> [1] "Elapsed time: 13.59"
# Generating the dot plots
gof_mes <- "NSE"
calib_dot(df_calib, gof_mes)

# }
# }